
Another week, another Data School Gym Challenge from Andy Kriebel, and another steep learning curve! The challenge is here:
http://www.vizwiz.com/2016/08/the-data-school-gym-running-to-middle.html
First thoughts are that I can have a go at forcing a connected dot plot to look like this, using the same methodology as in this post from a previous #MakeoverMonday attempt of mine. The only difference is that Circles are substituted for Gantt Bars, whilst Event is put on the Path on the Line chart axis.
One of the main problems is that the rounded ends of the line look like shown below. It’s not miles out, but this is Tableau: there must be another way (or three).
Attempt two was closer in some ways, but further off the mark in others. It also needed some research. First off I looked at the Gantt Chart post on this very blog, but examples there focused on conventional Gantt Charts. When all else fails: Google. That approach yielded this find on the Tableau forum, and I was specifically interested in this final post:

That sounds simple enough – let’s work through this step by step and see what we end up with. Step one is just to create the gantt itself, which is straightforward enough. I just dragged Event to the Filters shelf to pick out a single Event type. Next, I dragged State to Rows and Measure Values to Columns.
When the Measure Values Card appeared, I just removed superfluous Measures until I was just looking at Conservative, Liberal and Moderate Measure Values. When you want to create a shaded bar between gantt marks normally, you drag an existing (or create a new) calculated “Duration” Measure to Size to fill the gap between the Maximum and Minimum values in your range. However, “Craig G” says not to do that, so I won’t.
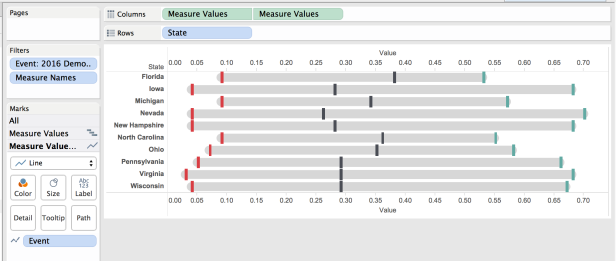
However, I ignored his suggestion to make the Gantt marks transparent, as there isn’t really a need to that if I ultimately want to see those Marks. This is how it looks so far, once the chart type is set to Gantt Bar:

Step two also sounds nice and easy, and it is. Once I right-clicked the x-axis, and selected Add Reference Line, the usual box appeared to fiddle with. I set my options as shown here:
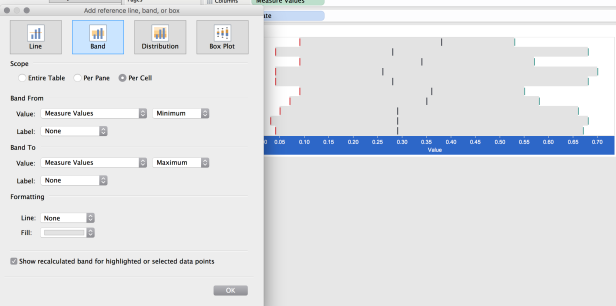
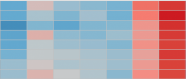
The important bits being the removal of Labels on the Band From and Band To sections, plus setting the Scope to Per Cell, in order to shade each State individually. So now I have nice flat ends to the shaded area unlike in the connected Gantt example, but I now have no white space between the Rows. Grrrrr. An image was tweeted accordingly, and Andy came back quickly with:

OK. So I need to go down the standard Gantt route and create a calculated field to show “Duration”, which I can then plonk onto Size and get a standard Gantt Bar? I haven’t done one of these before, but started by creating this “Duration” calculation:

So that should look at the State and the Event, and deduct the MIN vote share from the MAX vote share. When I look at the result in a text table, it appears to be correct:

The problem is, when I drag this to Size, this happens:

So, my Duration Field is causing me some bother, but I don’t actually “get” why. The overall “Value” of the x-axis is being overstated by the value of the Duration calculation, rather than filling in the space between the voter types.
I resorted to downloading Andy’s workbook in the end, but as it was published in Tableau 10, I can’t open it on the 9.3.x instances of Tableau / Tableau Public I have at home. Will try to sneakily open it at work tomorrow to discover the error of my ways. Then there will be the whole challenge of getting to grips with Floating objects…..
