Definition
Andy Kriebel stated:
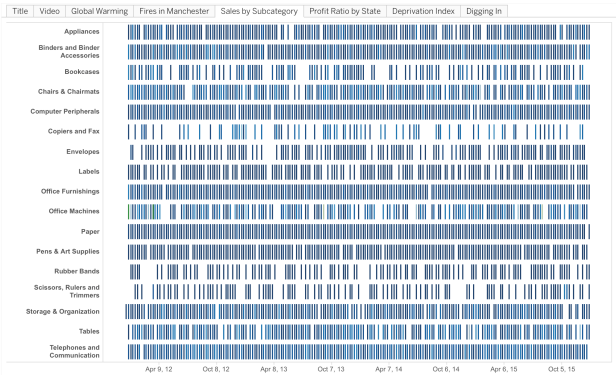
You may hear these also called barcode charts or frequency charts, but whatever their “official” name, they are very useful for:
1. Seeing a lot of data at a glance
2. Understanding concentration of the data
3. Seasonal trends
Videos
This is yet another subject matter where Andy Kriebel dominates:
Andy shared another video in December 2016:
Blog posts
Andy’s blog post is here:
http://www.vizwiz.com/2016/05/tableau-tip-tuesday-five-use-cases-for.html
Example workbooks
And his Tableau Workbook can be downloaded here:
https://public.tableau.com/profile/andy.kriebel#!/vizhome/StripPlots/Title